Benefit Start Analysis with
Social Security Analytics : Guided Tour
Introduction
Choosing when to start Social Security benefits is one of the most important retirement decisions most households will ever make. The timing affects lifetime income, survivor benefits, taxes, savings longevity, and overall financial security. Yet most calculators and other analysis tools only show what your benefit would be at 62, full retirement age, or 70 - not which choice is actually best for your household.
Social Security Analytics takes a different approach. It evaluates every possible start-month combination for you and your spouse, models your savings and expenses, and converts all outcomes into a single comparable value. This guide walks through the full process so you know exactly what to expect when you run your own analysis.
Analysis Steps
1. Start at the Social Security Analytics Homepage
The homepage introduces the purpose of the platform: helping you make a confident, financially sound decision about when to start Social Security benefits. From here, selecting the Get started link starts a new analysis session. The tool is always free to use.
2. Enter Your Household Information
Before the system can evaluate strategies, it needs a clear picture of your household’s retirement situation. Select the Analytics menu item to get to the main analytics page. The left-side navigation menu guides you through each step.
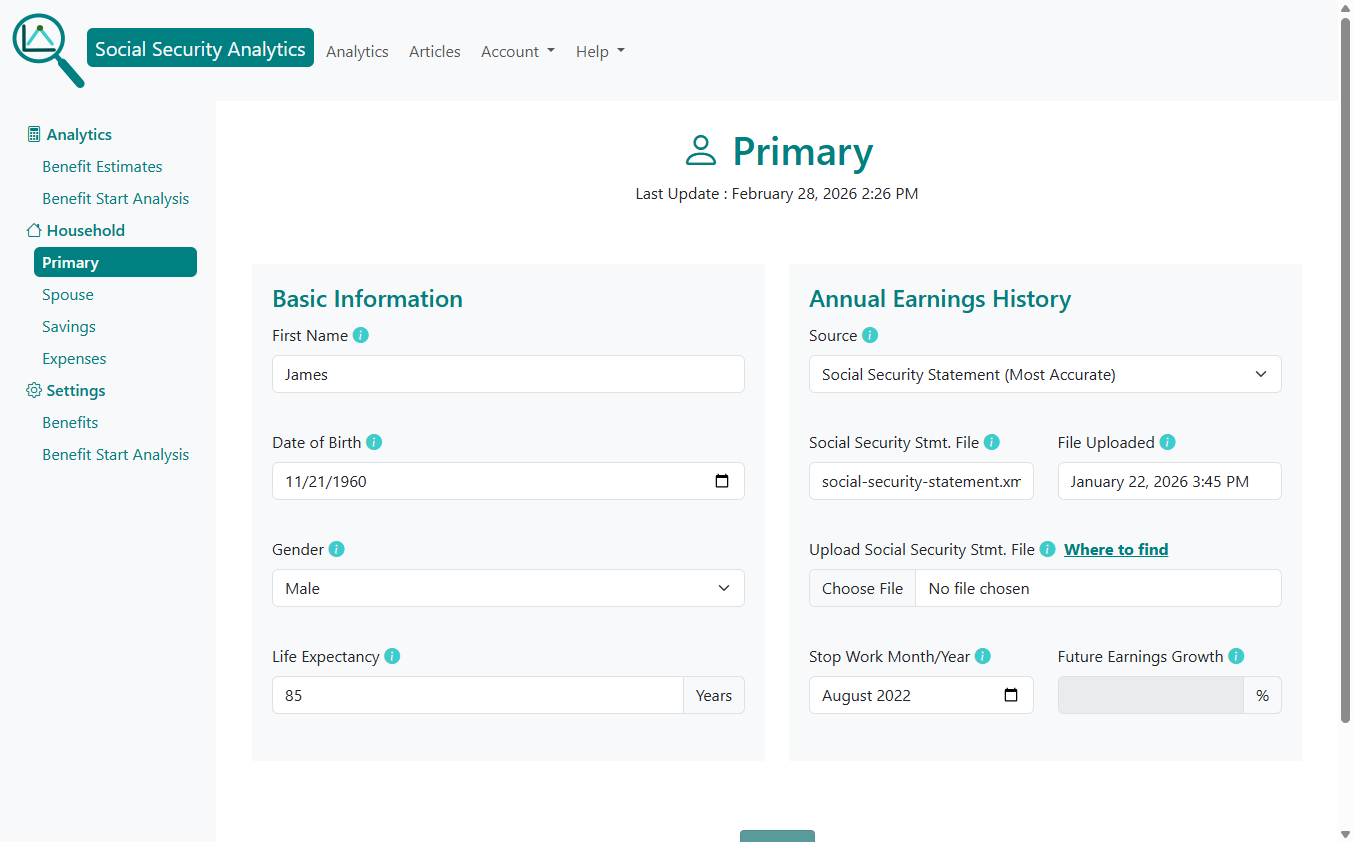
Primary Worker Information
You'll enter:
First name, Date of birth, Gender, Life expectancy, Annual earnings history,
Stop work month/year, Future earnings growth.
You can upload your Social Security statement for the most accurate earnings record. The system reads the file automatically.
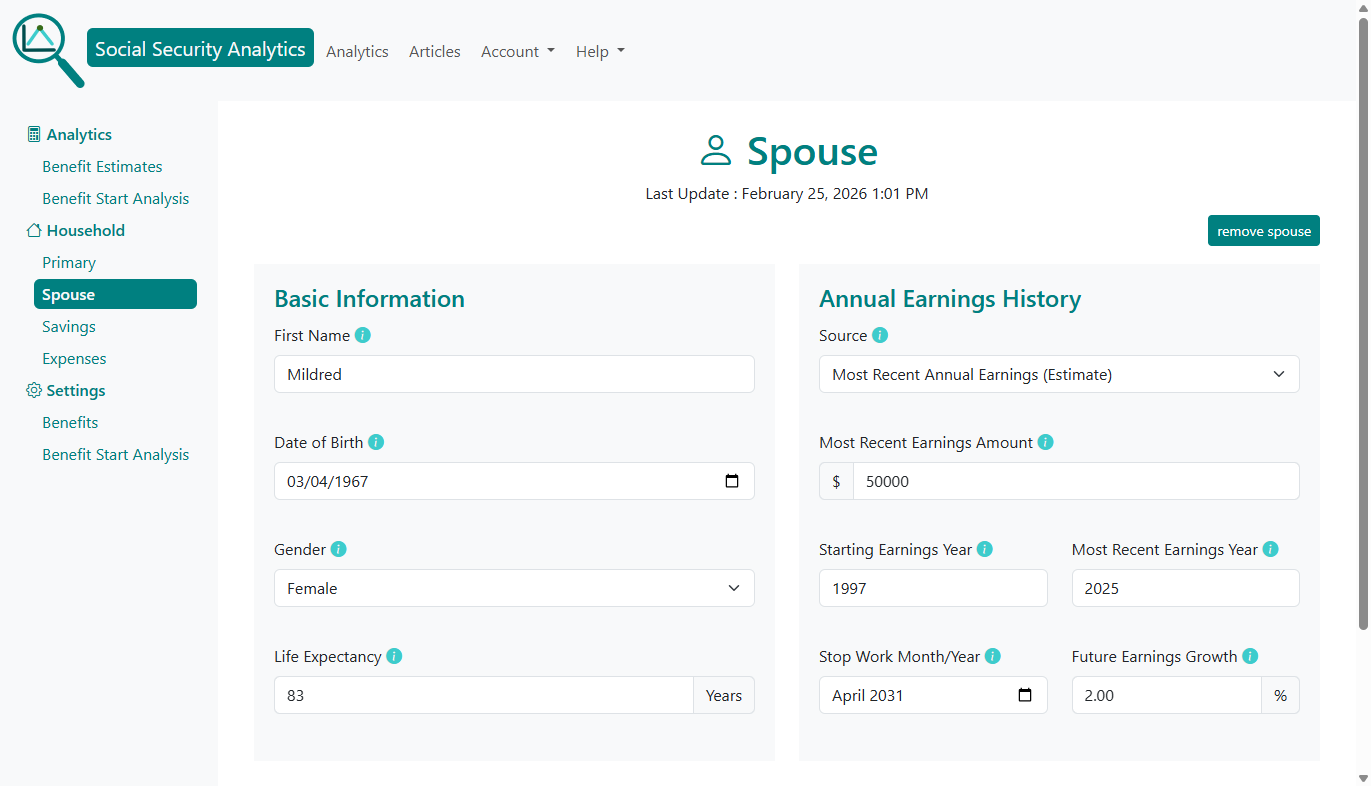
Spouse Information
If married, the spouse page mirrors the primary worker page. This enables the tool to model: Spousal benefits, Survivor benefits, Coordinated claiming strategies.
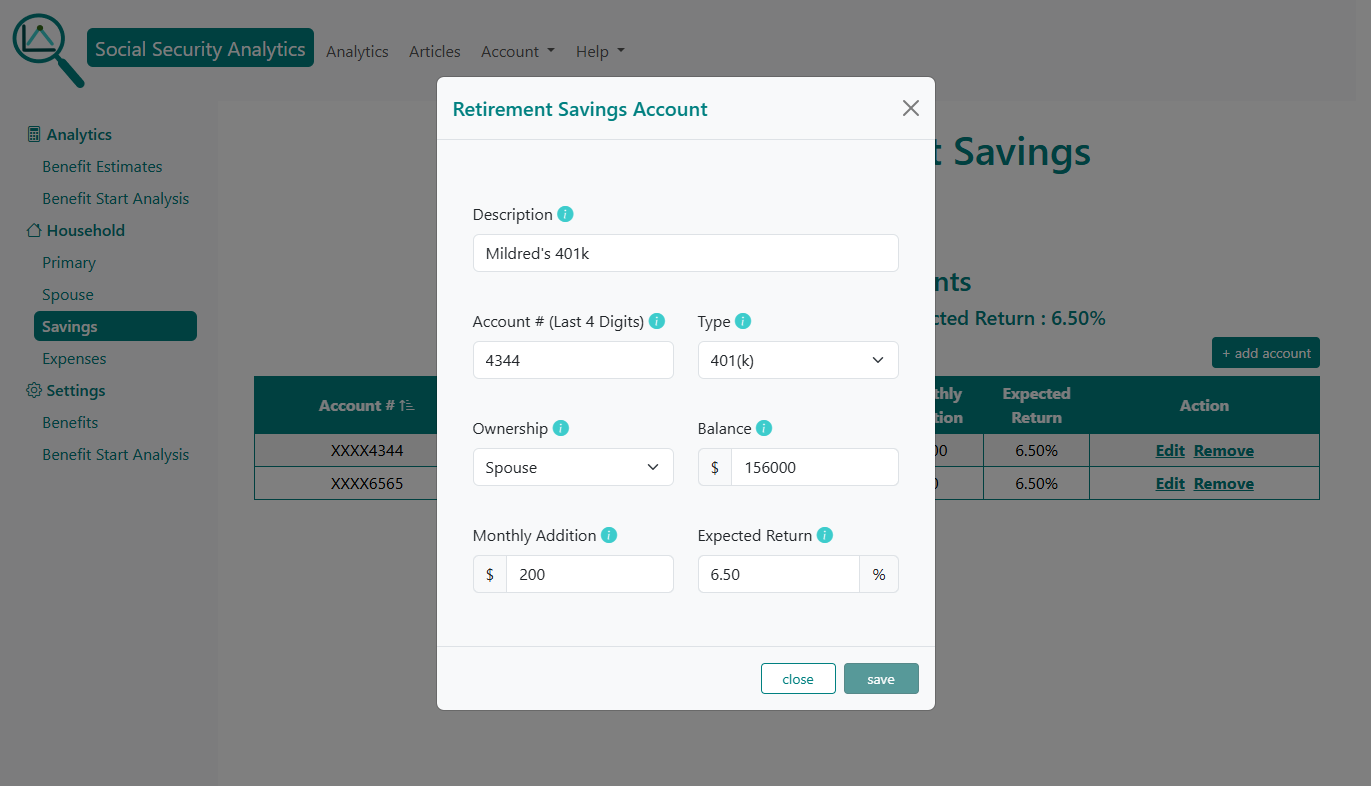
Retirement Savings Accounts
You can add any taxable, non-taxable and tax-deferred retirement accounts you hold. You'll need the following account information: Account type (401(k), IRA, Roth, etc.), current balance, monthly contributions.
These accounts help the system model withdrawals and long-term savings. You can find account information from your monthly statments and your online accounts.
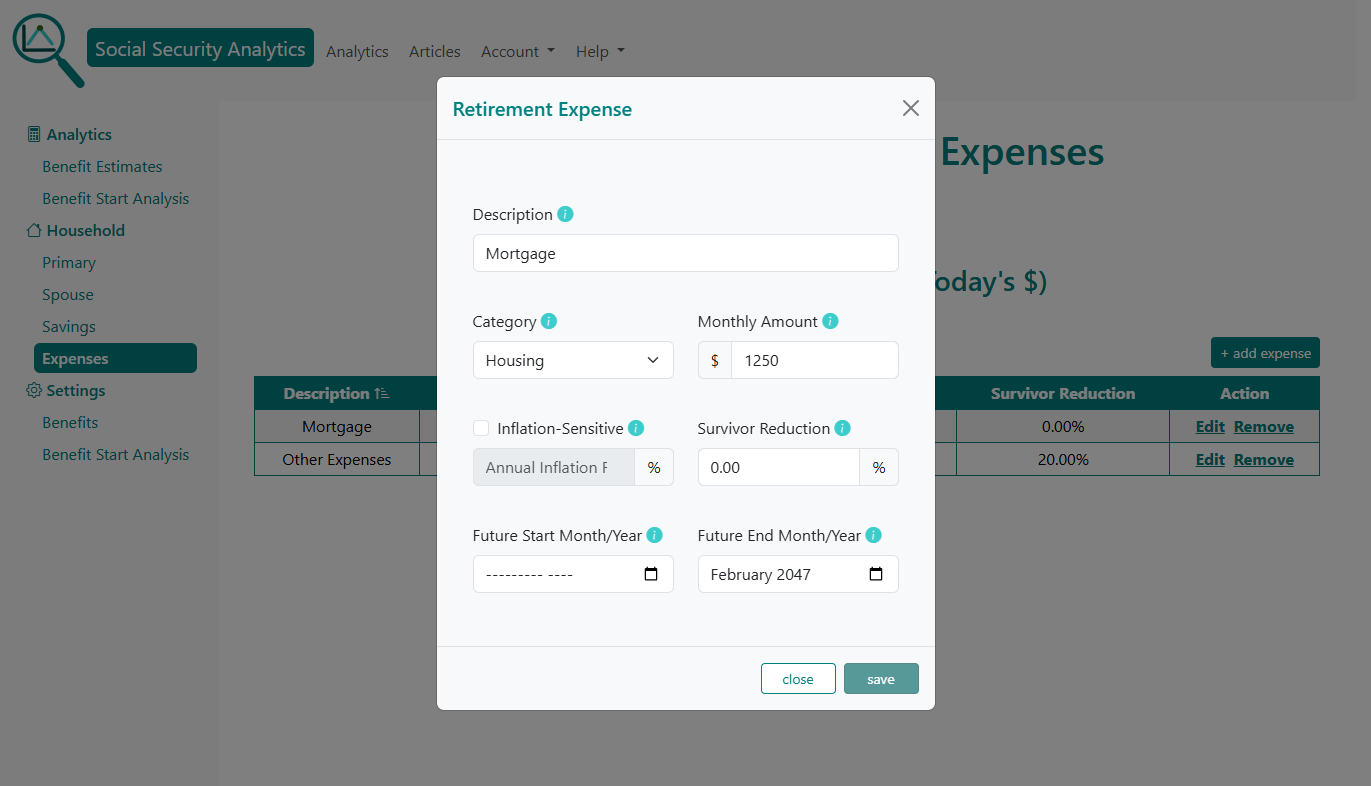
Retirement Expenses
You can enter recurring expenses such as: Mortgage, Food, Insurance, Utilities, Other living expenses. Each expense can be:
- Adjusted for future inflation
- Reduced for a surviving spouse
- Set to start and or end in the future
This allows the tool to calculate net cash flow each year of retirement.
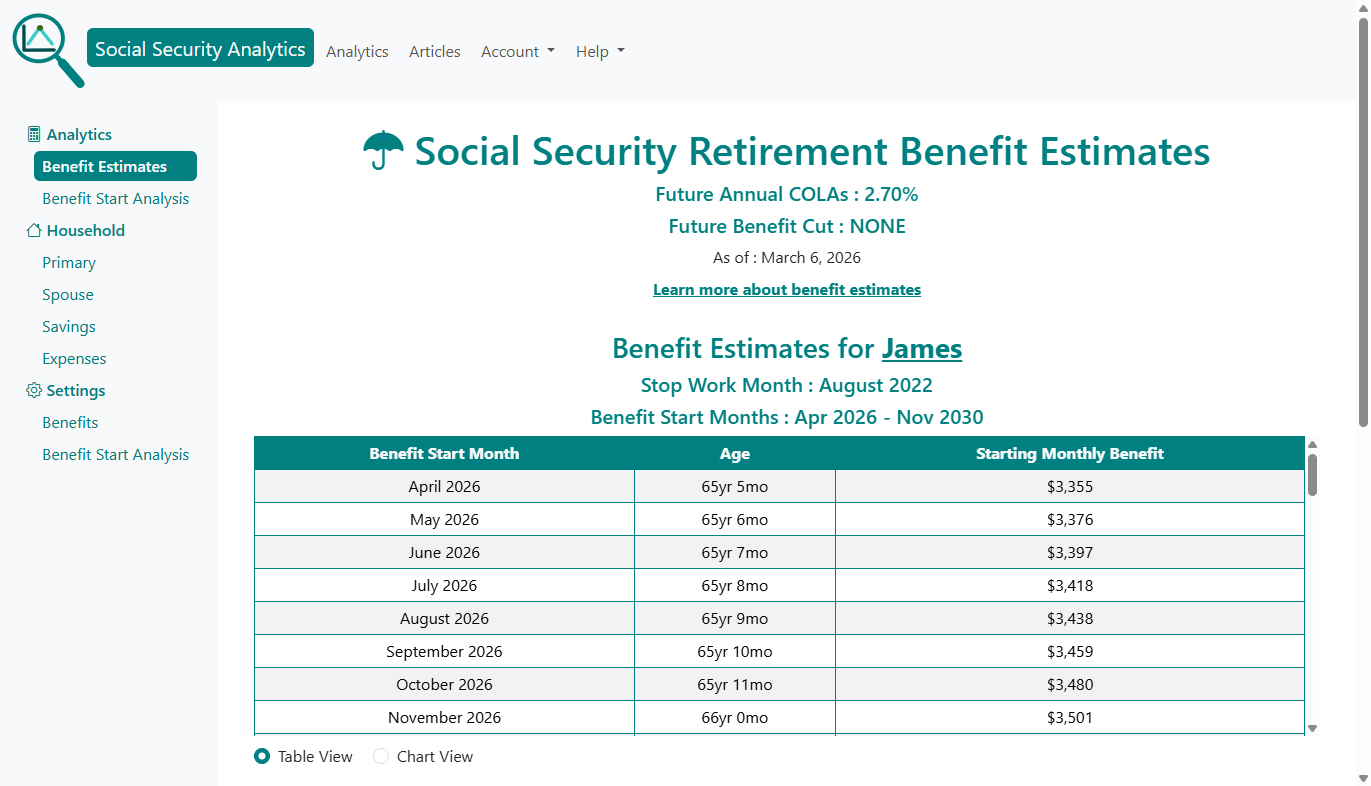
3. Review Your Social Security Benefit Estimates
Before running the full optimization, you can view estimated Social Security retirement benefits for you and your spouse at different claiming ages. This gives context for the upcoming strategy comparison. Select the Benefit Estimates menu item on the left side menu.
4. Run the Benefit Start Analysis
This is where Social Security Analytics stands apart. The system evaluates every possible start month for both spouses - often thousands of combinations. Select the Benefit Start Analysis menu item on the left side menu to run the analysis. For each strategy, the tool calculates:
- Value
- Cash Flow Quality Score
- Cash Flow Coverage
- Ending savings and loan balances
- Survivor outcomes
- Earnings test impacts
- COLA and inflation adjustments
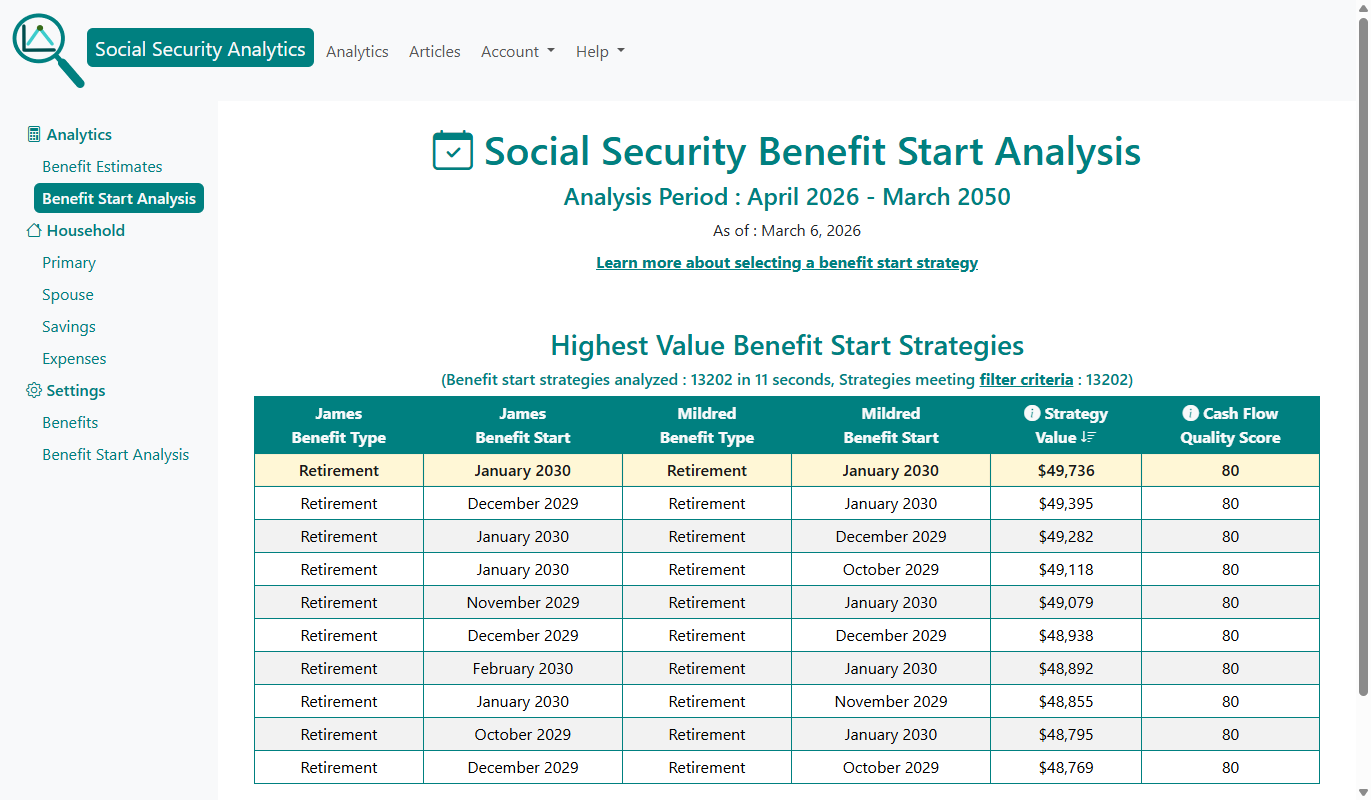
When the system completes the analysis, the Benefit Start Analysis Summary page is displayed showing the highest value benefit start strategies in descending order.
5. Compare the Highest-Value Social Security Claiming Strategies
For each strategy (row), the summary table shows :
- Social Security Benefit Type for each spouse.
- Social Security Benefit Start for each spouse.
- Value
- Cash Flow Quality Score
The top row represents the optimal strategy under your assumptions.
You can click any strategy (row) in the summary table to explore it in detail.
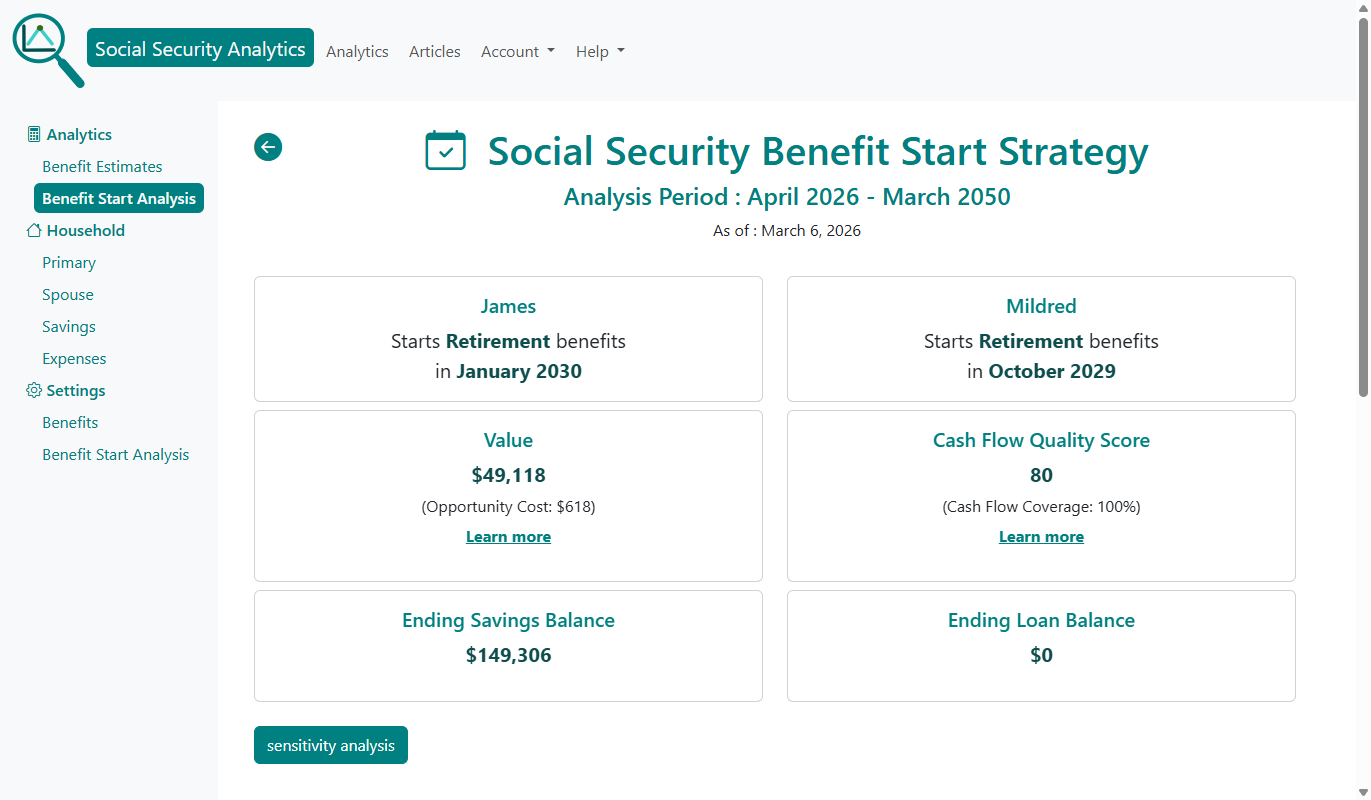
6. Explore the Claiming Strategy Details
When you click a strategy (row) in the summary table, the strategy's detail page is displayed.
The strategy detail page shows the information from the benefit summary table as well as:
- Strategy Opportunity Cost - the value you give up by not choosing the highest-value (optimal) strategy.
- Strategy Cash Flow Coverage - percentage of retirement months where cash inflows meet or exceed cash outflows.
- Total ending balance from all retirement savings accounts.
- Total ending loan balance if there was any borrowing during retirement.
The button at the bottom allows you to run a Sensitivity Analysis. More on this below.
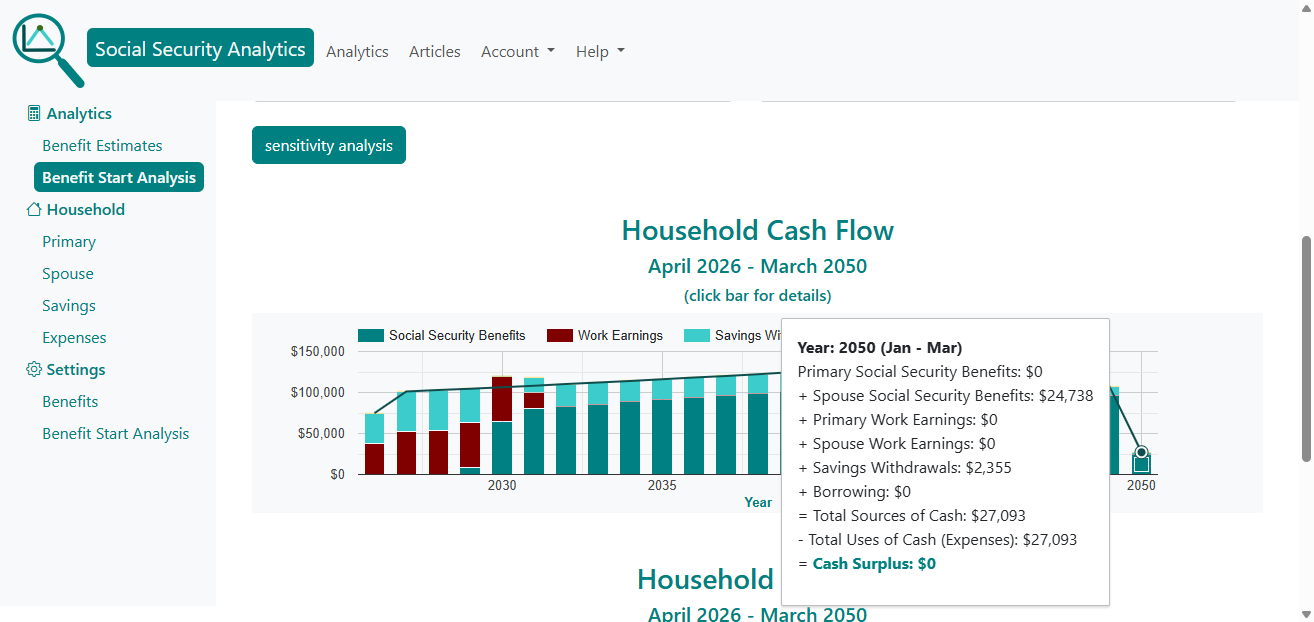
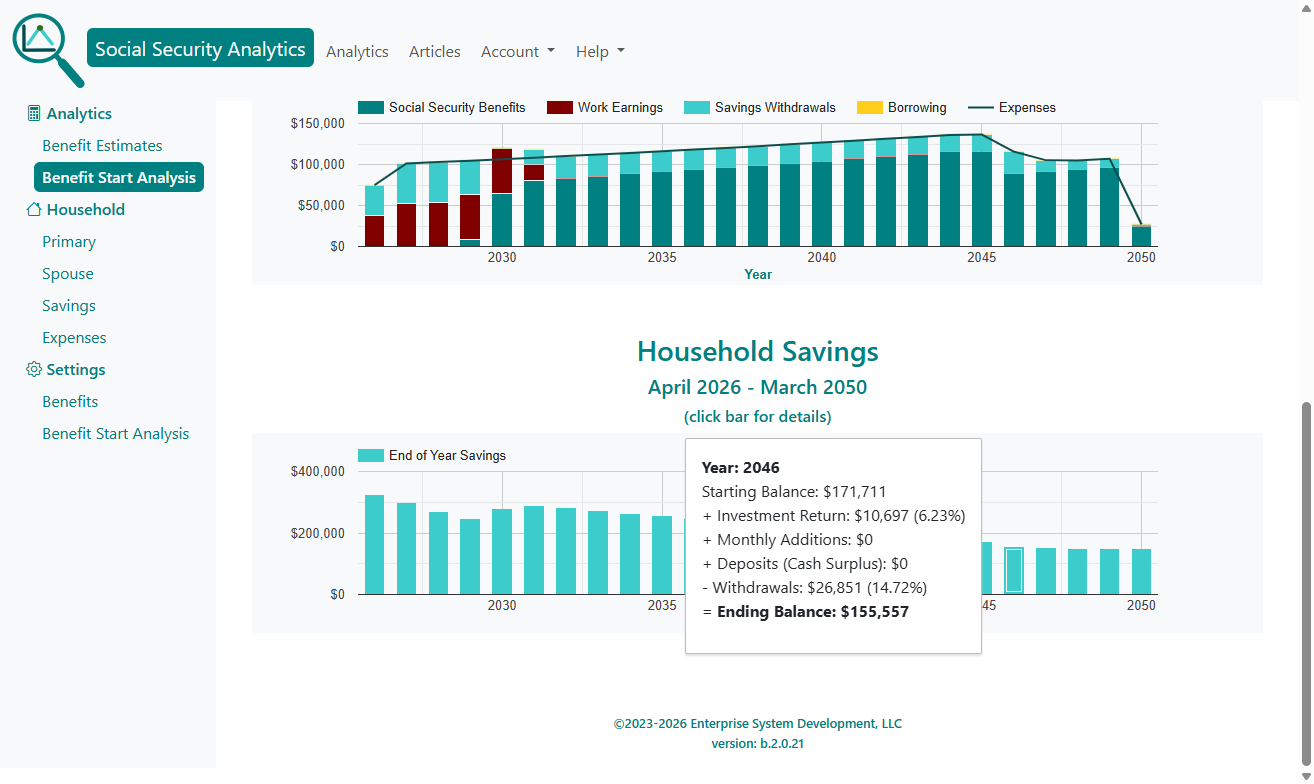
7. Understand Your Household Cash Flow
The strategy detail page cash-flow chart shows how your expenses are covered each retirement year using:
- Social Security benefits
- Work earnings
- Savings withdrawals
- Borrowing
Clicking a chart bar for any year reveals a detailed breakdown of sources and uses of cash.
8. Review Your Long-Term Retirement Savings Projection
A second chart shows your end-of-year savings balance through the analysis period. This helps you understand whether your savings are likely to grow, shrink, or remain stable under the chosen strategy.
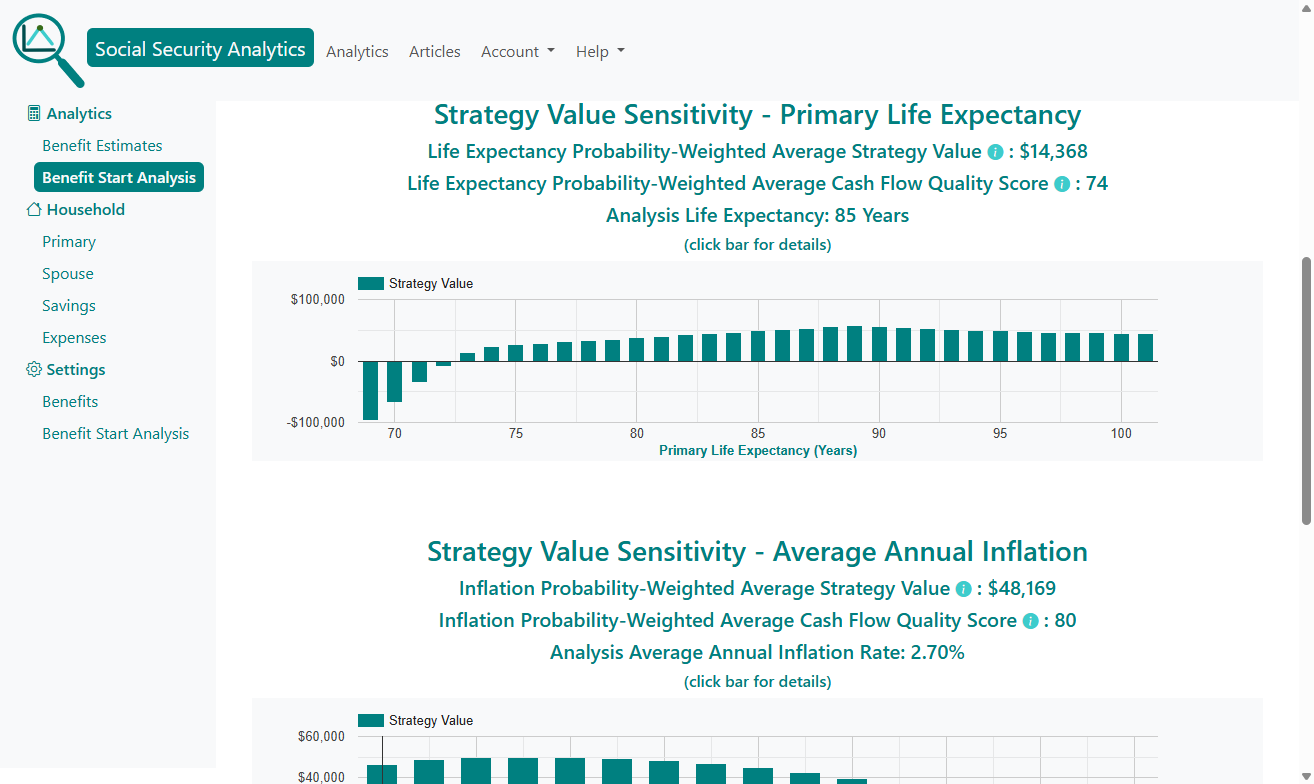
9. Evaluate Strategy Robustness with Strategy Value Sensitivity Analysis
Life rarely follows a straight line. Sensitivity analysis shows how your strategy performs under different assumptions.
Life Expectancy Sensitivity
This analytic evaluates Strategy Value and Cash Flow Quality Score across a range of lifespans. This helps you see whether the strategy holds up if you live longer or shorter than expected.
Inflation Sensitivity
This analytic evaluates how different long-term inflation rates affect the strategy. This is especially important for households with significant savings or inflation-sensitive expenses.
Social Security Benefit Cut Sensitivity
This analytic evaluates how different future percentage cuts in Social Security benefits affect the strategy. While a cut in Social Security benefits is highly unlikely, this chart gives you an idea of the reduction in the strategy's value should a cut occur.
10. Adjust Household Information and Settings Anytime
Make any changes to household information and setting, then click the Benefit Start Analysis menu item to run the new analysis.
11. Finalize Your Social Security Claiming Strategy
After reviewing the top strategies, exploring the details, and checking sensitivity, you can confidently choose the start months that best support your long-term financial security.
The tool is always available if your circumstances change - retirement plans shift, expenses change, or you want to revisit your assumptions.
It's a good idea to create an account and opt into our annual Social Security Review Reminder e-mail to make sure your analysis is up-to-date.
Help with Your Analysis
If you have questions about Benefit Start Analysis, make sure to check out our FAQs and benefit start analysis help.
Conclusion
Social Security Analytics transforms a complex, high-stakes decision into a clear, data-driven comparison. By evaluating every possible start month, modeling your savings and expenses, and presenting results in a single comparable value, the tool gives you the clarity you need to make a confident decision.
Whether you’re planning years ahead or deciding right now, this analysis helps you choose the strategy that maximizes your household’s lifetime financial security.
Get started with your benefit start analysis
Further Reading
- Social Security Administration - Retirement Planner.
- Social Security Administration - Cost of Living Adjustments (COLA).
- IRS - Taxation of Social Security benefits.
- Centers for Disease Control and Prevention - Life expectancy.
- Social Security Benefit Types.
If you have any questions or comments, please contact us